Description
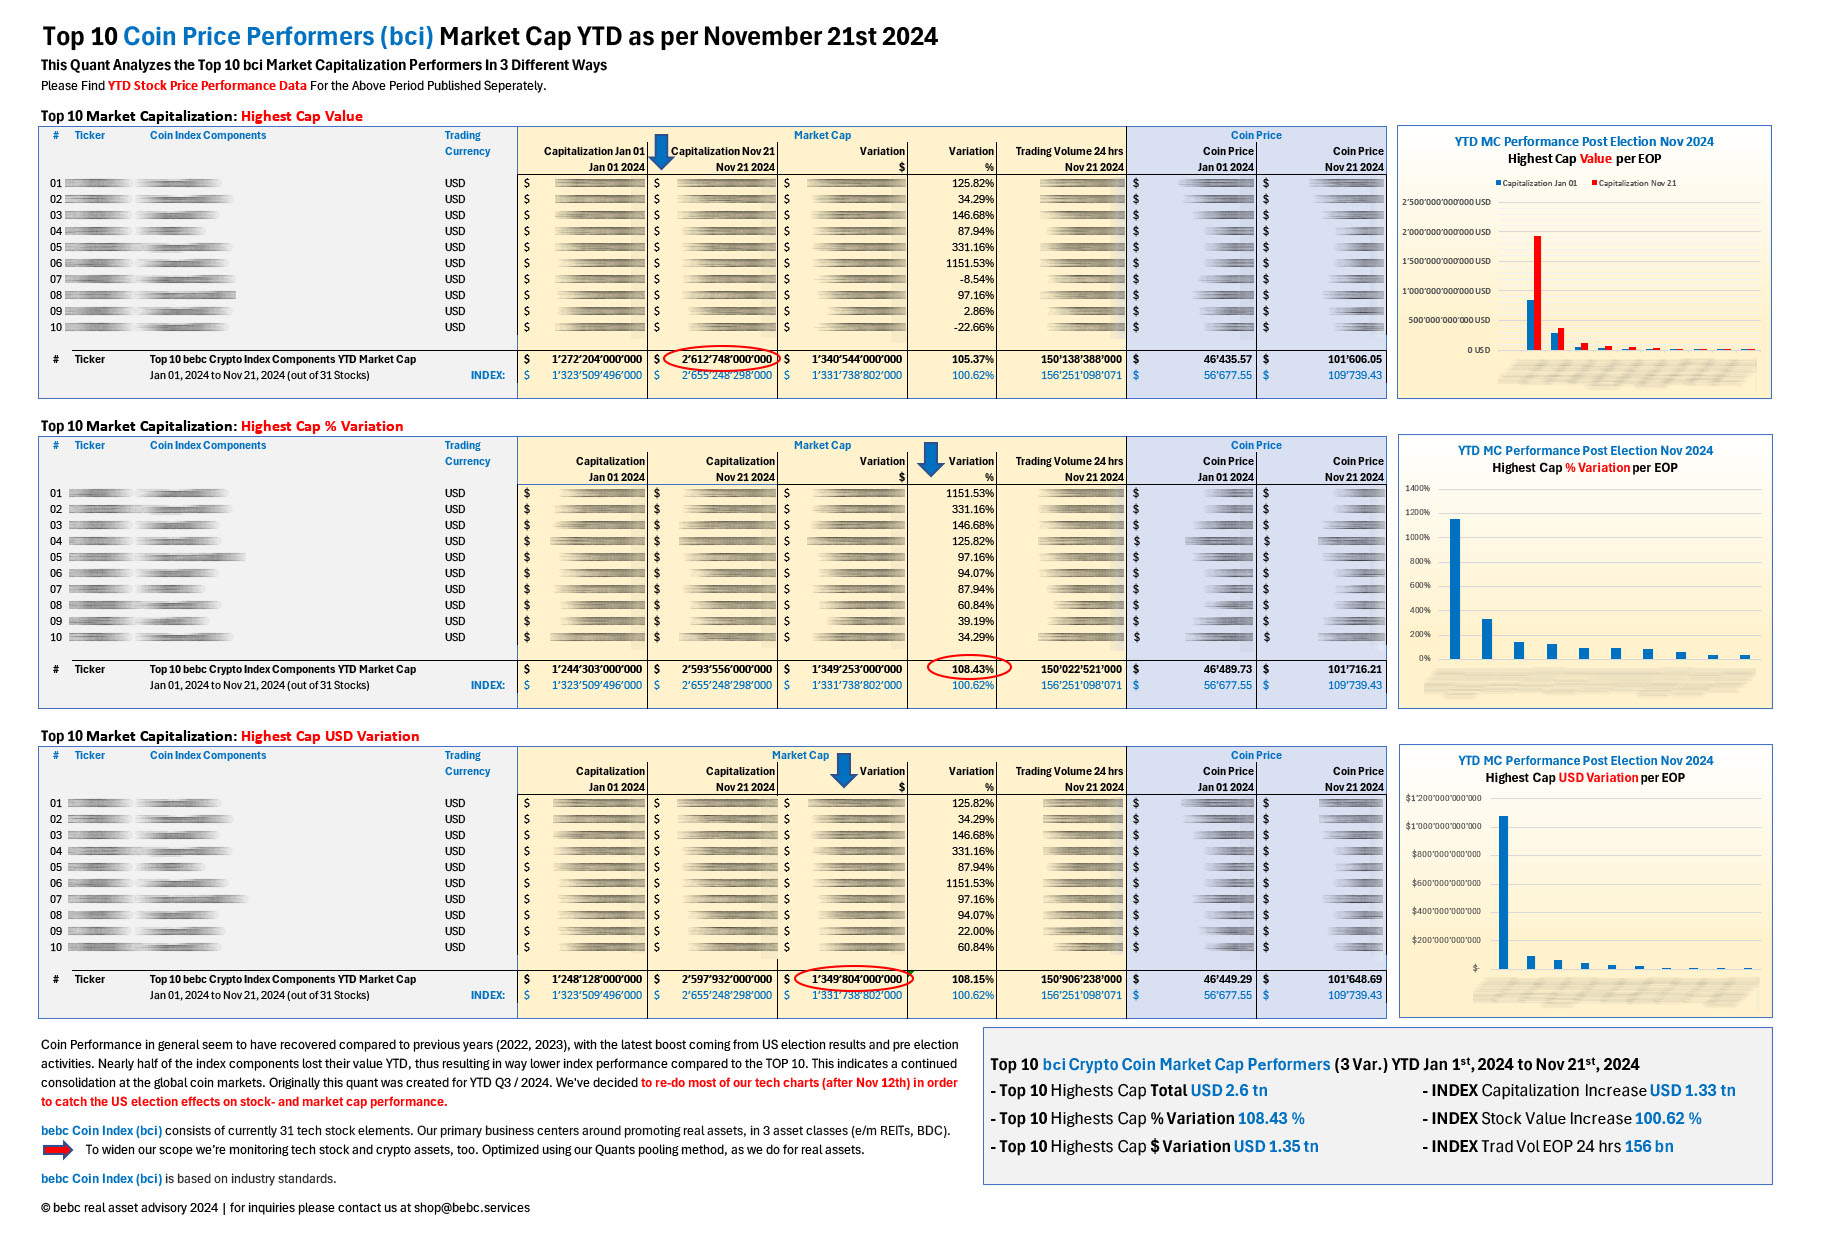
Top 10 Crypto Coin MARKET CAPITALIZATION Performers per Nov 21 2024, in 3 Categories:
-
- Highest Cap Value
- Highest Cap Variation in %
- Highest Cap Variation in Value (USD)
TOP 10 Crypto Coin Market Cap Performance averaged YTD at 108.43 %, Index (31 coins) total YTD at 100.62 %
Coin Performance in general seem to have recovered compared to previous years (2022, 2023), with the latest boost coming from US election results and pre election activities. Nearly half of the index components lost their value YTD, thus resulting in way lower index performance compared to the TOP 10. This indicates a continued consolidation at the global coin markets.
Originally this quant was created for YTD Q3 / 2024. We’ve decided to re-do most of our tech charts (after Nov 12th) in order to catch the US election effects on stock- and market cap performance.
bebc crypto index (bci) currently consists of 31 layer one and layer two coin elements. Our primary business centers around promoting real assets, in 3 asset classes (e/m REIT, BDC). But we’re monitoring digital assets, too. Optimized using our Quants pooling method, as we do for real assets and other tech stock indices.
Please feel free to subscribe to the newsletter service at our homepage.


Reviews
There are no reviews yet.