Description
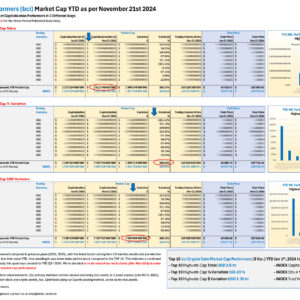
Top 10 bti Tech Stock MARKET CAPITALIZATION Performers per Nov 12 2024, in 3 Categories:
-
- Highest Cap Value
- Highest Cap Variation in %
- Highest Cap Variation in Value (USD)
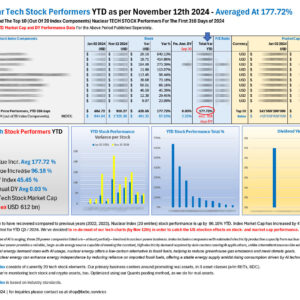
Index Cap Performance YTD for this period, all 368 components: at 17.22%
Tech stocks in genereal seem to have recovered compared to previous years (2022, 2023). bti INDEX stock performance (368 entries) is up by 17.22% YTD (averaged). INDEX Market Cap has increased by 27.85% YTD since Jan 2024.
Originally this quant was created for YTD Q3 / 2024. We’ve decided to re-do most of our tech charts (by Nov 12th) in order to catch the US election effects on stock- and market cap performance.
bebc tech Index (bti) consists of currently 368 tech stock elements. Our primary business centers around promoting real assets, in 3 asset classes (e/m REITs, BDC). To widen our scope we’re monitoring tech stock (in differnet asset classes) and crypto assets, too. Optimized using our Quants pooling method, as we do for real assets.
Please feel free to subscribe to the newsletter service at our homepage.


Reviews
There are no reviews yet.