

Description
Top 10 BDC DIVIDEND Yields YTD Jun 30 2023: averaged at 15.45%
Index Dividend Yields for this period, all 43 components: averaged at 11.84%
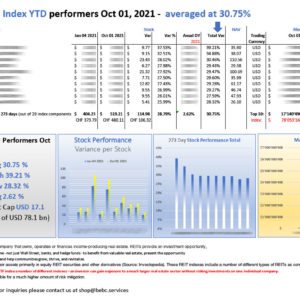
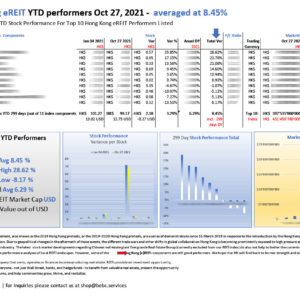
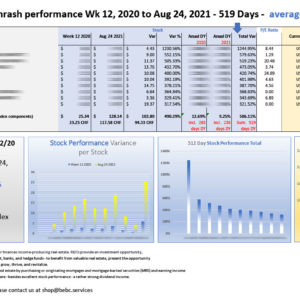
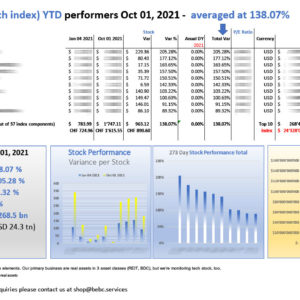
Despite the Ups and Downs we saw in almost every asset class during the last 12 month, BDC Dividend performance still holding up against all stock performance related volatility. Similar to what we see with US e- and mREITs.
BDCs stock performance in the first six month of 2023 mirrors that of almost every other asset class in the real asset segment.
A business development company (BDC) is an organization that invests in small- and medium-sized companies as well as distressed companies. A BDC helps small- and medium-sized firms grow in the initial stages of their development. With distressed businesses, the BDC helps the companies regain sound financial footing.
BDCs provide financing for income-producing real estate companies while being state regulated similar to REIT companies (REIT ACT). Therefore BDCs are not only high performers stock wise but also are subject to high dividend yields, which is interesting for long term investments (Buy and Hold investment mentality).
bebc BDC Index is based on industry standards.
Please feel free to subscribe to the newsletter service at our homepage.
Reviews
There are no reviews yet.